Human Data Interaction: Ensure data solutions fit human needs to create valuable insights.

What is Human-Data Interaction (HDI)?

Humanizing business processes and data solutions through a human centered approach.

In today’s digital landscape, data has become the lifeblood of many businesses. It’s critical to have the right tools, processes, and data visualizations in place so that people can interpret this data as useful information.

With Human Data Interaction (HDI), we ensure that solutions seamlessly fit both your business goals and the needs of the people that use the product or process daily. We are strategic UX designers that see data as a mean that, when leveraged correctly, supports users in optimizing processes and achieving their business goals. By understanding the users of the data and involving them in the process, we create data solutions that are understandable and valuable. HDI bridges the gap between technical solutions and human needs, ensuring that the right insights are delivered effectively.

Human Data Interactions enable you to:

Reduce costs by avoid wasting spending time on unnecessary rework and lowering the time spent on tasks of your people.

Increase adoption rates of your solutions by reducing the complexity and involve your user from the start.

Increase your business value by making better informed decisions based on insights from usable data.

Optimize the usability and accessibility of products and services.

Improve the user experience (UX) and satisfaction by gaining deeper understanding of your users.

Optimize your business process by getting a deeper understanding of your business problem and define valuable solutions.

Simplify and make data accessible.

To develop suitable solutions, we believe that data is only useful when it’s transformed into meaningful information. By making sure people understand the data that is provided, business can make well-informed decisions. That’s why we specialize in translating complex data into actionable insights and helping clients understand the “why” behind the data. This helps to optimize processes and create the best possible experiences for users.

"Involve people in the design of your data-solutions to realize the right value"

Lindsey van der Lans

Managing Director, Bright Cape

How does HDI work?

Designing intuitive solutions that make data understandable to people.

HDI focusses on designing tools, (back office) applications, interfaces, and data visualizations that allow people to interact with data intuitively, efficient, and effective. We believe in putting humans at the center when developing solutions. Our human-centered strategy consulting helps clients embed the value of working with people at the core of their organization. Our approach aligns with the design thinking framework, where we first discover the right problem and understand the end user needs.

1. Understand

  • Comprehend the context, business problem, and process
  • Empathize with the end user to understand their needs.
  • Define the actual problem and goal based on this understanding.

2. Explore

  • Ideate, prototype and validate ideas with the end user
  • Find suitable solutions that fit user needs and add value to the company.

3. Materialize

  • Ensure the intended design is developed correctly
  • Embed the solution into your organization effectively.

Overall, HDI delivers an iterative design process with a focus on understanding user needs within the company context. This approach creates solutions or process optimized for interacting with complex data, supporting your business goals.

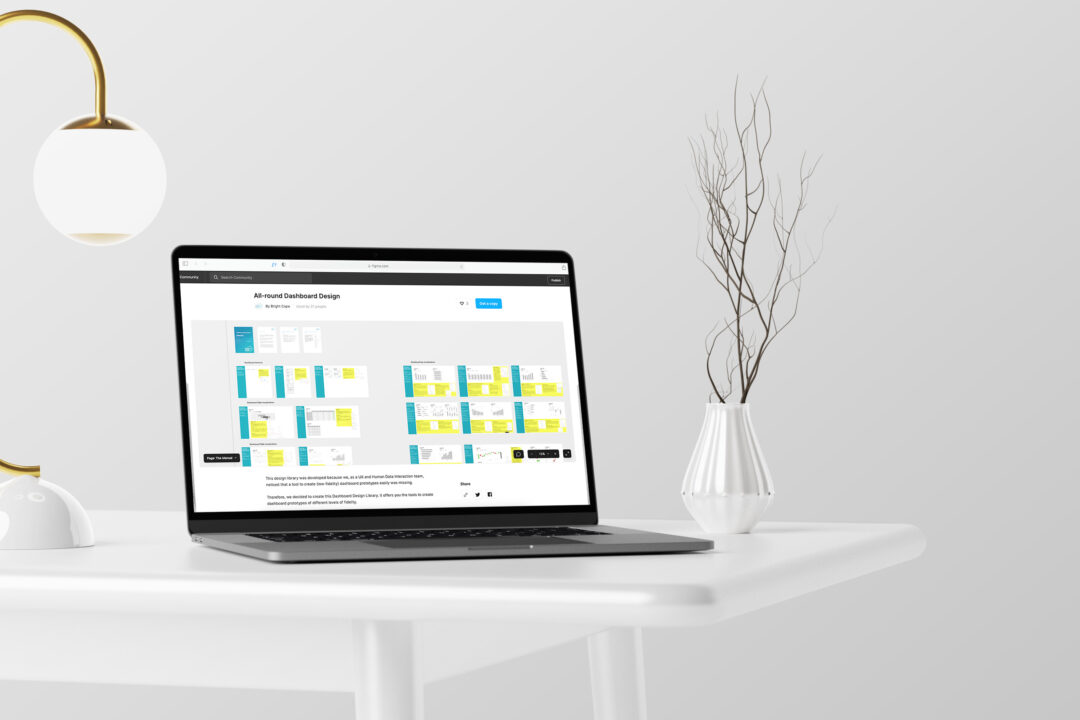
Blog: Take advantage of our data visualization prototyping design library

With the ever-growing amount of data, dashboards are a great means to visualize what is happening in your organization. But often dashboards end up not being used because they do not cater to the needs of the end-user. And if your data solution does not fit the expectations or is no fit for the end-user, it will have no value. We have now created a library that allows people to prototype faster and thus validate solutions faster.

How can we help you?

We deliver clear, tangible and measurable results.

Our team applies the design thinking framework to develop intuitive, evidence-based solutions. We use performance metrics to measure the effectiveness of our work, providing concrete results to our clients. Whether your business needs guidance on maximizing the value of its data, adopting new products, or making data-intensive tools more user-friendly, we can help. Take advantage of our expertise in Human Data Interaction to make meaningful connections between people, data, business, and technology.

Some of our highlighted use cases

Making faster and better strategic business decisions with data from user friendly dashboards

This international client in the beer industry significantly changed the way of reporting and dashboarding. Instead of working Excel-based, they switched to SAP Analytics Cloud, a business intelligence tool. To ensure that the dashboards in the new tool met the users’ needs and were user friendly, the HDI from Bright Cape joined in. By combining the knowledge of a HDI expert with that of a Data Scientist, Bright Cape has enabled our client to gain more insights from their data, enabling them to make faster and better strategic business decisions.

Increasing customer value with a monitoring dashboard

SARA Robotics is a company that provides care robots. They were facing the problem that the current system to monitor the use of their SARA robots at different locations was very cumbersome and time consuming. A dashboard was created that allows team SARA to quickly gain insight into how their robots are being used at different care facilities and that helped identifying root causes in case of a problem. Furthermore, the data pipelines that have been implemented are a sustainable solution.

Is your company looking for a direction to get more value out of its data? Is there an existing product that you would like to adopt and roll out as effectively as possible? Or do you want to make a tool or dashboard as user-friendly and meaningful as possible?