Increasing customer value with a monitoring dashboard

Reference Case

Client profile

Client: Sara Robotics
Industry: Healthcare
Process: Monitoring

SARA Robotics is a company that provides care robots named SARA. SARA is developed as a solution to the increasing shortage of healthcare professionals we face in the Netherlands to provide support and reduce their workload.

Additionally, SARA can improve the well-being of residents living in care facilities. SARA offers, amongst others, entertainment in the form of songs, audio stories and physical and cognitive exercise.

Problem

Team SARA was facing the problem that the current system to monitor the use of their SARA robots at different locations was very cumbersome and time consuming. This could lead to delayed intervention when SARA robots are not used at all or not used as discussed at a certain care facility, which could even result in decreased client trust.


Solution and multidisciplinary approach

Together, team SARA and Bright Cape worked towards a solution to tackle this problem. Bright Cape strives to reach operational excellence for its clients by offering sustainable data solutions, which can be delivered end-to-end whilst applying a human-centered approach. In this project, this was achieved by not solely looking at the data driven solution but also through investigating the needs of team SARA and applying an iterative design process. Taking the desired requirements of team SARA into account, the combined expertise of Data Engineers, Data Analysts and Human Data Interaction Consultants created a fitting solution.

After an initial interview with the product owner of team SARA it was clear that the most important needs of team SARA were to gain more insight into whether a robot is used and, just as important, how it is used. In order to fulfil these needs a dashboard was created that allows team SARA to quickly gain insight into if and how their robots are being used at different care facilities.

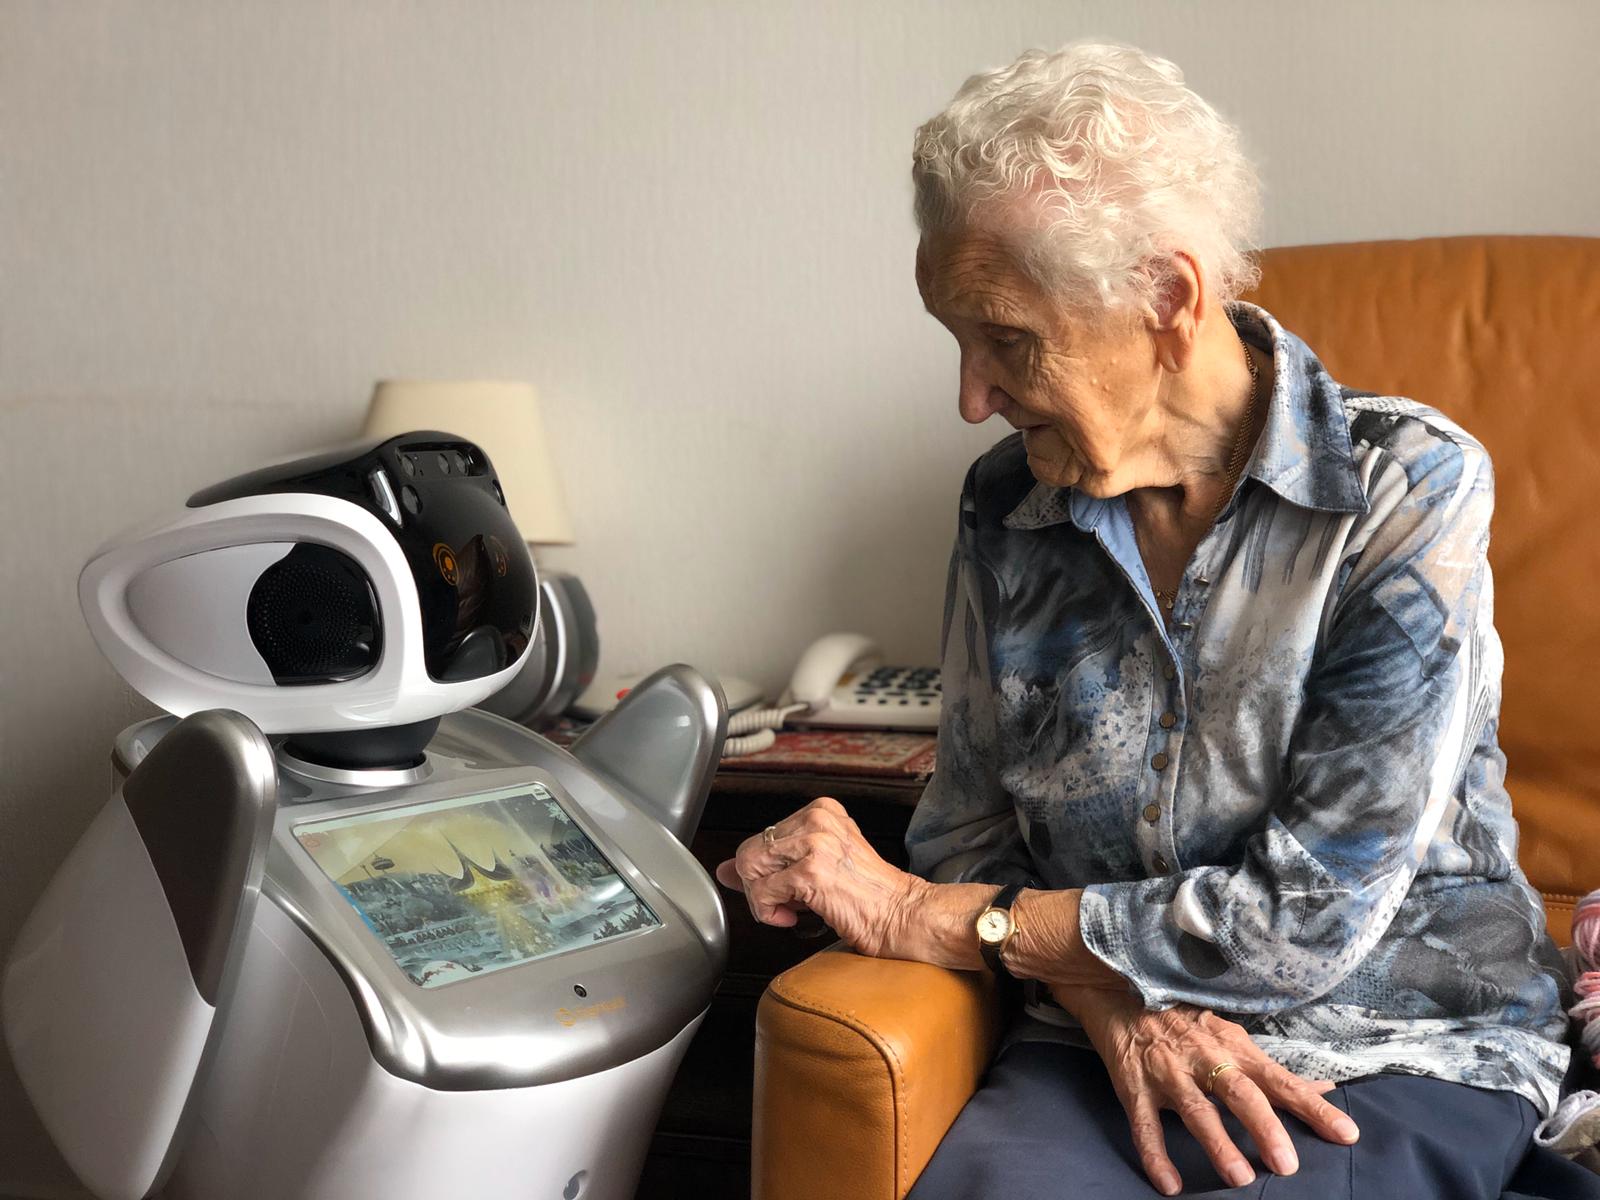
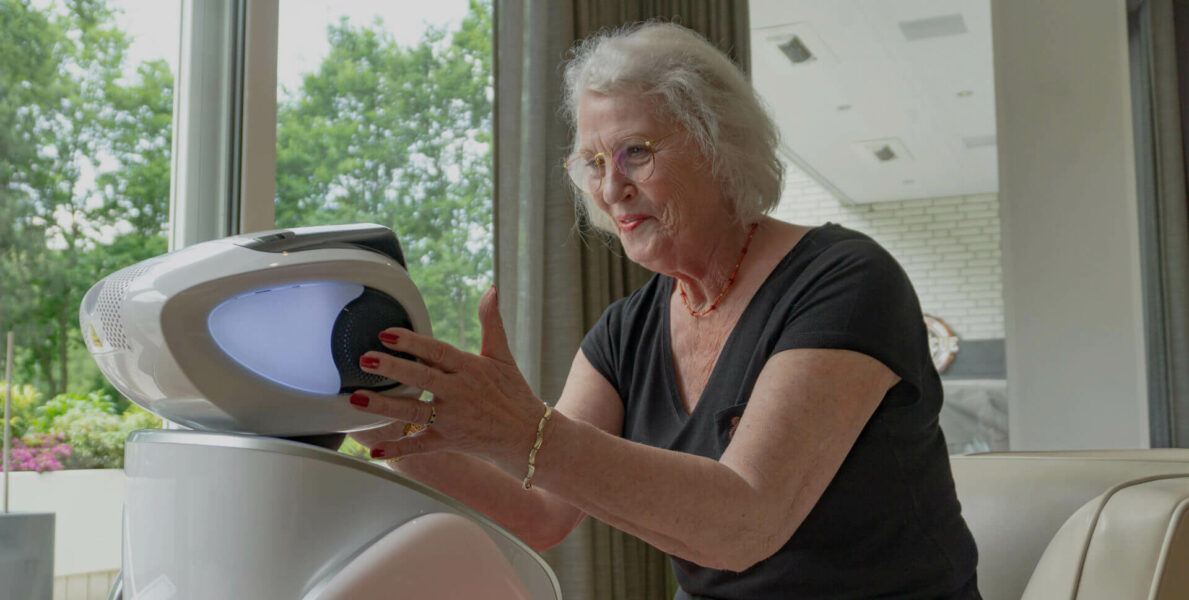
An important part of this solution was transferring the data from SARA robots to a dashboarding tool. Firstly, a data pipeline was created to transfer and store the data in the existing data storage solution. To be more precise, APIs were used to transfer the data from robots to the Azure cloud, where the data was stored a structured form in Azure Tables. Secondly, the data was transformed and loaded into a dashboarding tool (Microsoft Power BI) in order to be visualized. When residents interact with a SARA robot, data about the interaction is logged. For example, the type of activity, the duration, and the time stamp. This data gives great insight into how SARA robots are deployed.

With the use of this dashboard, we are able to closely monitor the Sara’s at our customers and we can use the insights to build business cases

A. Hermans

Product Owner of Sara Robotics

During the development process regular meetings with team SARA showed why Bright Cape is diligent in following an iterative design process and holding regular client contact. For example, the need insight into how a robot is used, was first visualized using a bar chart with each unique robot IDs on the x-axis. In practice, this was not convenient for team SARA as they now still needed to look up to which location a specific robot belonged, before they could take action. Changing the robot IDs to the department names the robots were on, improved the effectiveness of the dashboard a lot.

That’s why our human-centered approach is so important, because it’s not about how we think a solution should work, but more about creating a solution that fits the expectations of the customer to make it useful and thus of added value to their business needs.

Added value

This dashboard fulfils the needs of team SARA as it gives them quick insight into how their robots are being deployed at different care facilities. This enables them to quickly intervene in case of a problem. Additionally, this dashboard also contains several pages that allow for a deep dive in the data that provide additional insight into the use of the robot (e.g., At what times are they most used or what specific activities are most popular) and that can help identify root causes.

Furthermore, the data pipelines that have been implemented are a sustainable solution, since these can easily grow by adding different types of interaction data to it.

Results

Increased data insight

Through the monitoring dashboard

Quick intervention

When robots are not deployed (optimally)

Scalable data solution

By deploying a cloud-based data pipelines solution

Where there is data, there is benefit for your business

There is no such thing as having little or no data. From our experience and throughout our projects we come across organisations with a great amount of unexploited data. Accounting, operations software and other sources create data that can be beneficial to organisations. The dataset available in this project was rather small (just some details about the activity a robot was used for e.g. Robot ID, timestamp, location, activity type). However, what this project showed is that even when a company gathers a limited amount of data, we can extract valuable insights to create added value for their business.

Other projects

Case Study

Making faster and better strategic business decisions with data from user friendly dashboards

All sales data comes together in our clients current reporting system. The company makes strategic decisions based on the insights from these reports. However, the current reporting method is cumbersome, complex and there is no coherence in the way of reporting. Moreover, the data are hardly visualised, which makes it...
Case Study

Improving financial mid- and back office processes

Tell us your challenge.

We are here to help you

Get in touch with our experts