Bright Cape created a design library for dashboards for quick prototyping

At Bright Cape, we offer the unique discipline Human-Data Interaction (HDI). This discipline bridges the gap between data and people. Together with our Data Analysts, Data Scientists, Data Engineers, and Process Mining Consultants our Human Data Interaction Consultants form an integral part of our multidisciplinary team that is constantly working on creating insights to optimize processes. Data science offers many possibilities, but it is incredibly important to always take the end-user into consideration. Therefore, it is crucially important to ask yourself what the person asking truly wants to see in his/her dashboards and monitors in order to steer effectively on the processes. And here is where our HDI expertise comes into play. Does the end-user just need a number, a table, or a KPI with information or is there more to the question?

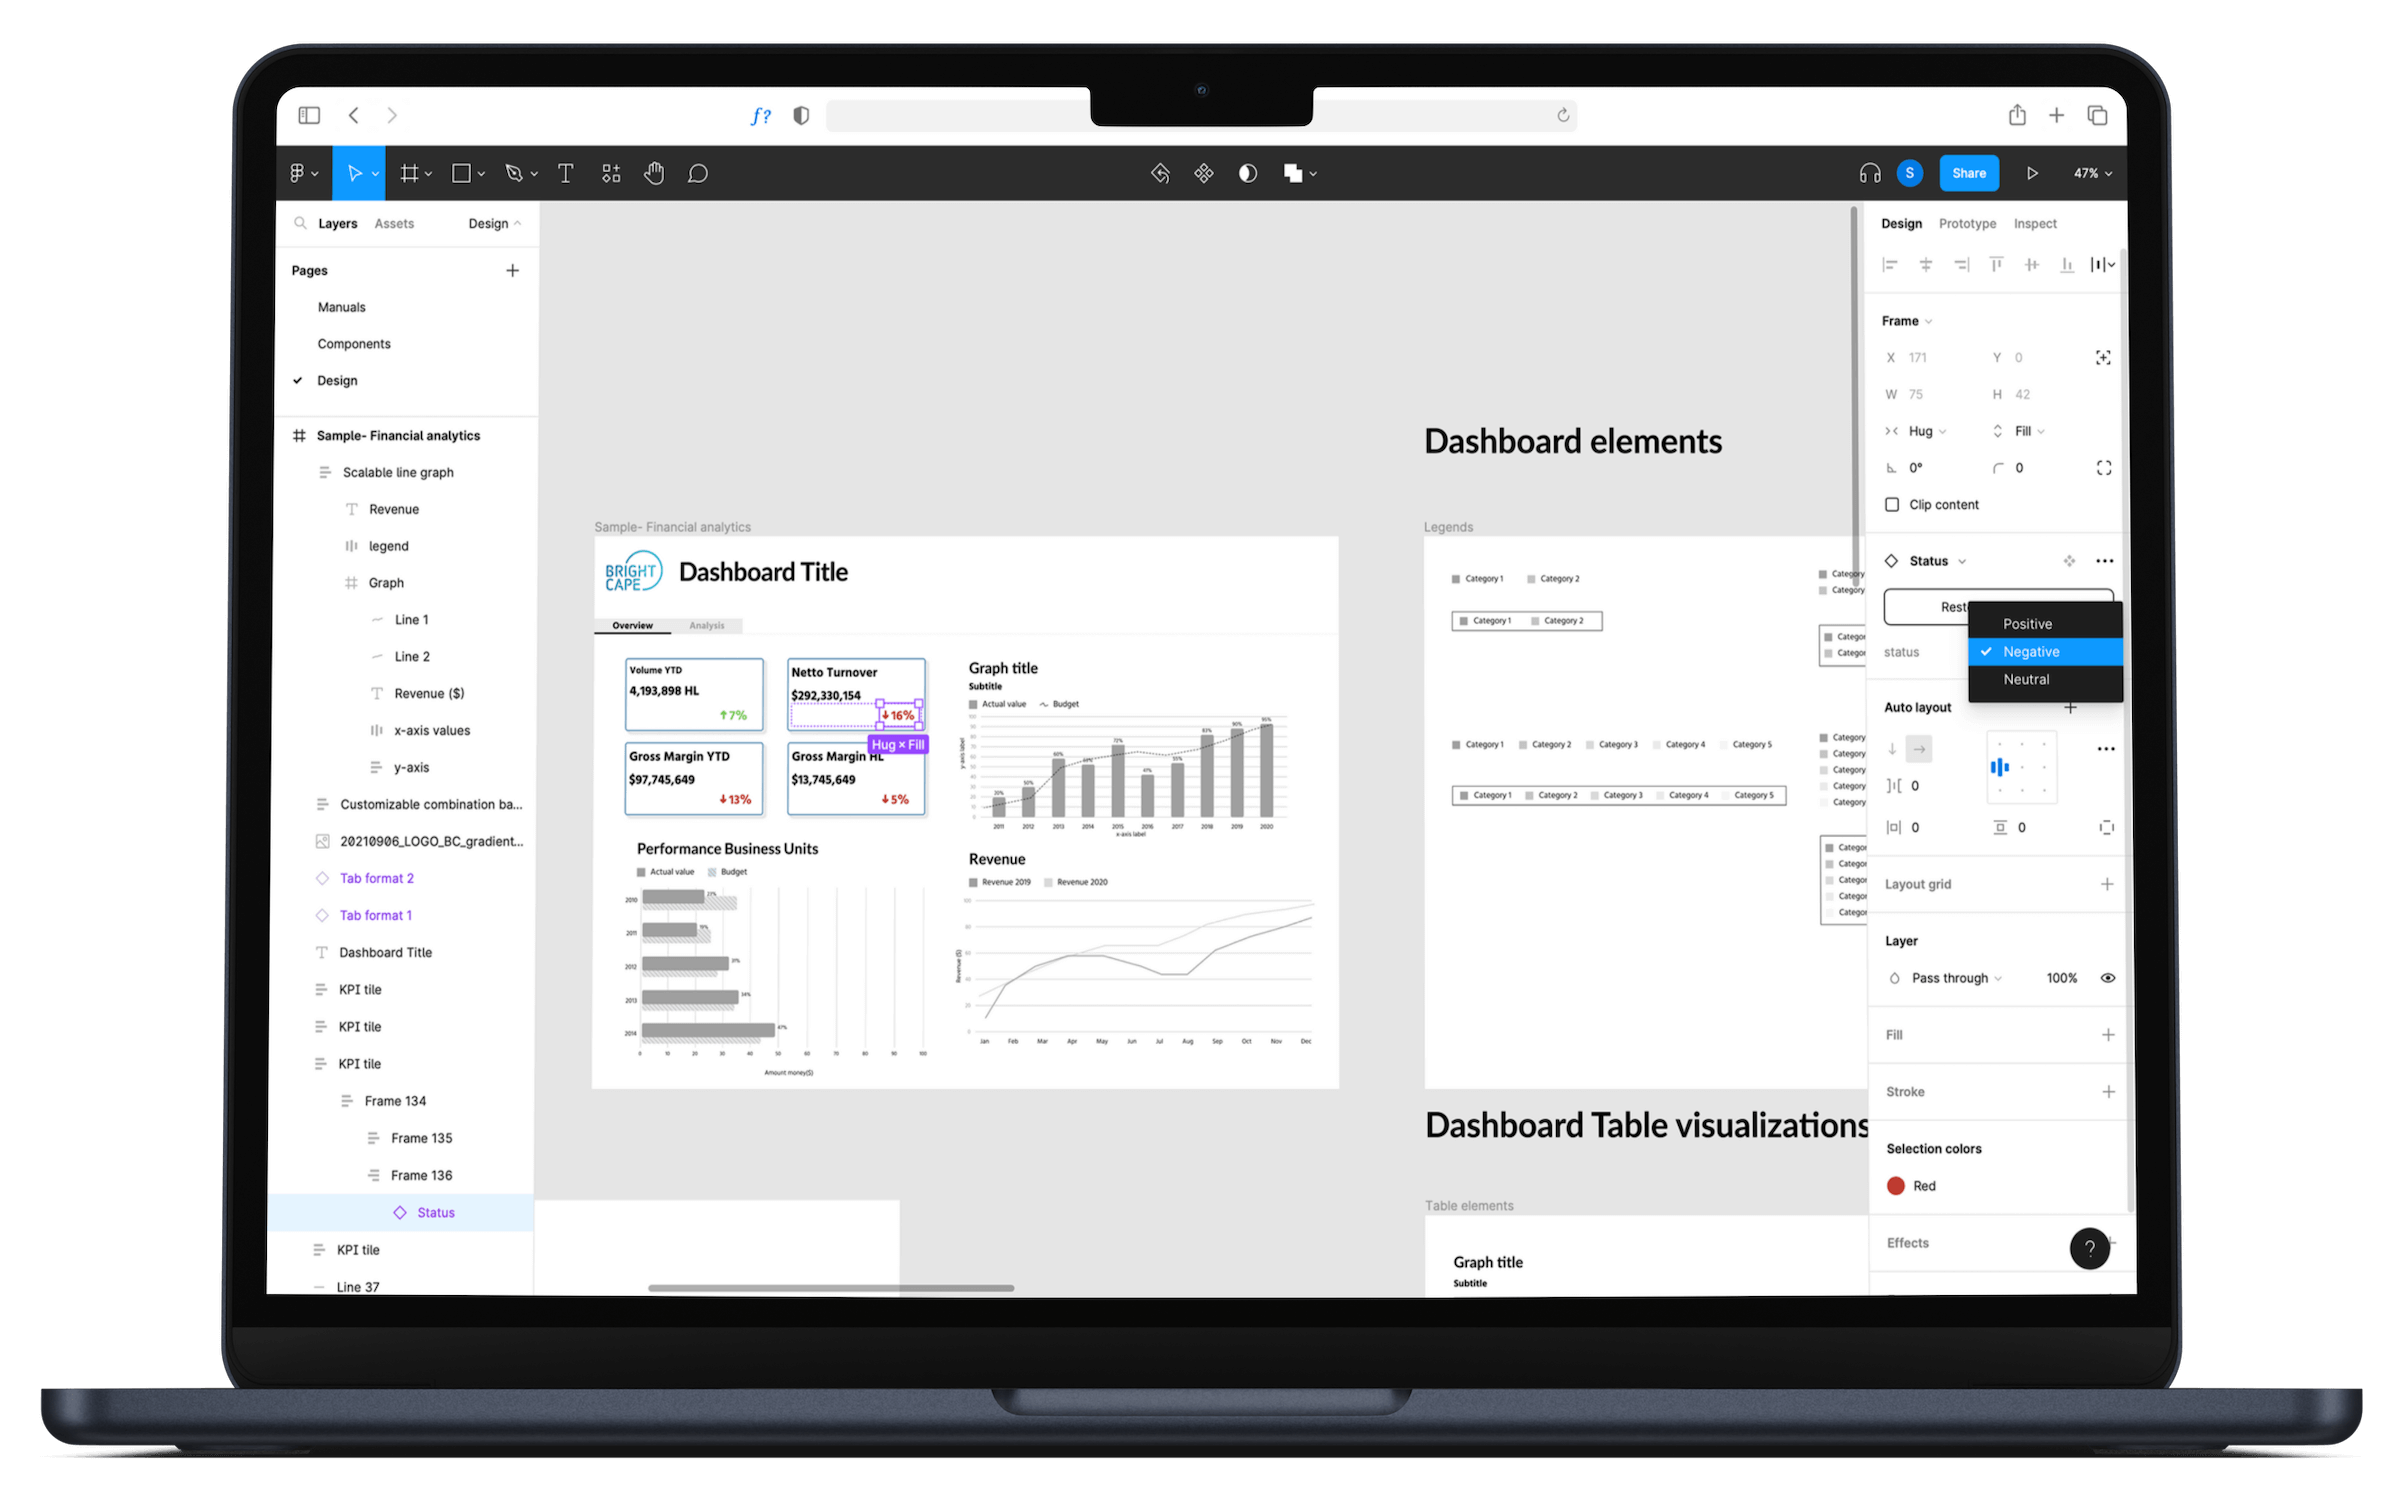
With the ever-growing amount of data, dashboards are a great means to visualize what is happening in your organization. But often times dashboards end up not being used because they do not cater to the needs of the end-user. And if your data solution does not fit the expectations or is no fit for the end-user, it will have no value. We have now created a library that allows people to prototype faster and thus validate solutions faster.

Two of our consultants from HDI team, Lotte Sap (HDI Consultant & Data Analyst) and Muhan Liu (HDI Consultant) are the force behind our unique library to create low-fidelity dashboard prototypes. This library is freely available to everyone. Read along as Lotte and Muhan take us on their journey for the reasons behind their idea.

Dashboards and Design Thinking

Nowadays, a lot of data is gathered, and many businesses like to visualize their data to gain more insight into what is happening. One common problem that many businesses face is that they have created dashboards to gain insights in their data, but these dashboards end up not being used.

A possible cause could be that the end-users are not completely involved in the development of the dashboard. And therefore missing the point of value for the users. A way of doing this and evaluating upfront is to consolidate the requirements into a prototype and test before the dashboard gets launched.

Design thinking is a great framework to develop new products or processes. It starts with discovering the needs of the most important stakeholders and then follows an iterative process to eventually come to a good end product. A very important part of the design thinking process is prototyping. Prototyping is the process of making (interactive) mock-ups of your end product that you can test. This will allow for quick iterations and improvements of your final product, without the need to rebuild or reprogram your end product every iteration.

Prototyping is the process of making mock-ups of your end product that you can test

The lack of a suitable design library for dashboarding

A problem that we as HDI team faced was that we did not have a design library that allowed for quick prototyping of dashboards. Drawing a prototype by hand or with design software can be time consuming and does not allow for quick changes.

With the ever-growing amount of data and the request for dashboards, we figured that we would not be the only people facing this problem. Therefore, we decided to build our own dashboard design library! We created our library in Figma, a web-based design application that is great for teamwork and freely accessible to everyone. We shared our All-round Dashboard Design in the Figma Community so it is available for other teams to use as well!

Check out the Design Libary


The benefits of the design library

Our library allows you to prototype dashboards on different levels of fidelity. It can be as simple as drag and drop, but each visual can be finetuned to create higher levels of fidelity. What makes this tool special is that it is dynamic, meaning when you change a small thing on a certain graph, the rest of the design will auto-fit the changes into the proper size and look. Additionally, the visuals available in the library are not based on a certain dashboarding software like for example Power Bi, Spotfire, or Tableau but on commonly used visuals in dashboards in general, making it useful for everyone!

“Drawing a prototype by hand or with design software can be time consuming. We wanted to create a library that is user-friendly and based on commonly used visuals in dashboards, making it useful for everyone!”

– Lotte Sap (HDI Consultant & Data Analyst) and Muhan Liu (HDI Consultant)

Usability testing and supporting materials

Under the guise of practicing what you preach, we also conducted user tests during the development of this tool with, amongst others, user experience designers (UX designers). This helped to improve the tool in looks, use, and completeness. Furthermore, written and video tutorials were created and included to improve the usability of our tool!

Download the manual

"*" indicates required fields

This manual supports you in creating quick prototypes with our Figma library. It provides you more information about types of dashboards and visualizations, dashboard principles and the design language system of our Figma library.


By completing this form, I agree to the privacy policy and that my contact information may be shared with Bright Cape.

This dashboard library is not just valuable for UX research and design, it can also help e.g., data analysts to align dashboard content and appearance with stakeholders to avoid extra work. Furthermore, this library is valuable for clients and stakeholders as it will allow us to create better and more suitable dashboards quicker!

Usability testing the Figma dashboard

Curious to know how Bright Cape can help you make a tool or dashboard as user-friendly and meaningful as possible?

Get in touch with Lindsey van der Lans (Managing Director and Manager of the Human Data Interaction Consultants). Our combined expertise of data scientists, data analysts, data engineers, and HDI consultants are able to think ahead to understand the problem and what the data should help solve.  We have  the know-how to help retrieve value from your data to make a difference in your daily operations. We will help you understand your data and its context. You will then use these insights to make well-considered choices to optimize your processes and steer your organization in the right direction by putting people first and designing data and technology to meet human needs.