Automating collecting and monitoring commentary reports for YouKnights

Reference Case

Client profile

Client: YouKnights
Industry: Business Consulting & Investment
Process: Financial reporting

YouKnights, a Dutch business consulting and investment company, helps companies deal with their business growth, change or succession issues. In doing so, they contribute to the growth and transformation of an organization and, as a result, achieve excellence. YouKnights adds value by participating and collaborating with the organization’s management, providing the necessary resources and insight to make the right decisions.

Problem

The YouKnights team monitors the financial and business development of its clients’ organizations through a monthly commentary report. This report is provided by each management team and includes financial and business development commentary on human resources, commercial and operational status. In addition to these reports, the YouKnights team consults a Power BI dashboard with insights into the financial status of their investments.

1. Difficulties to compare data

The YouKnights management team recognized the need to combine the information from the comment reports with the quantitative data from the dashboard. In its current state, the monitoring process was not as efficient as desired because it was cumbersome to compare results and insights from previous months.

2. Inefficient collection of reporting information

In addition, YouKnights management team identified an inefficiency in the collection of high volume comment reports from various organizations: participants were reporting qualitative data through various channels, and there was no standard way to collect, retrieve, and store participant comment reports.

Approach

Therefore, taking the desired requirements of the YouKnights management team into account and with the combined expertise of Human Data Interaction and Data Analytics, Bright Cape created a fitting solution. 

This cross-combination of competences not only enhanced our understanding of the client’s needs, but also ensured that all key stakeholders, such as financial controllers and investment managers, were involved in the process. This was essential to understand how the solution would be implemented. 

A user-centered design approach was followed in which we:


Understand and define

User research: The Bright Cape team began by ensuring that all variables were understood, gathering requirements from YouKnights management and interviewing stakeholders.

Define data-driven requirements: These results were collected, analyzed and then translated into a set of clear requirements for the dashboard, which were validated with stakeholders.


Ideate, prototype, test

After reviewing these insights and considering possible solutions, a new phase began: prototyping and testing with various stakeholders.

Wireframing and prototyping: Based on these requirements, ideas were translated into low-fidelity wireframes to test and compare different visualization ideas.

User testing: The feature and flow were continuously tested with end users to reduce the risk of low adoption or low usability while satisfying all user types.

Continuous validation: In addition, an iterative process with regular meetings with YouKnights management was followed during this exploration phase to ensure that what was being built remained in line with their requirements.


Development phase

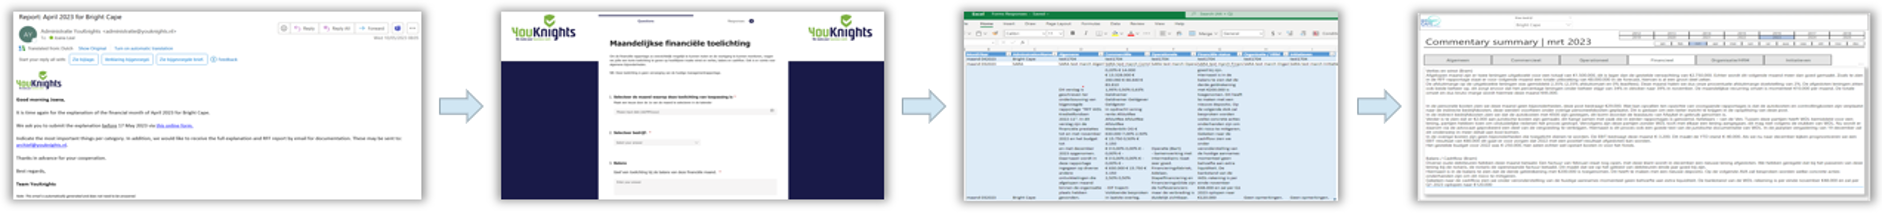
After this essential phase of understanding and exploring all possible alternatives, from different tools to different combinations of flows, we arrive at the solution that best meets the customer’s needs and has the least impact on the workload of other stakeholders involved. A flow in Power Automate to collect the report and automatically feed it into the Power BI dashboard.

The dashboard has been customized to integrate the new commentary report summary, so that the qualitative data from the monthly reports can be collected and combined with the quantitative financial data on the Power BI dashboard to complement the financial insights.

In addition, a third Power Automate flow was created to verify that organizations had completed the survey and to send a reminder if they had not.

Result

Ensure consistent and automated data collection

By implementing the automatic workflows in Power Automate, we have not only helped standardize the way participation reports are collected, but we have also automated the process of collecting the reports. This ensures that people submit the reports by sending automatic emails and then reminders to those who did not respond the first time. In addition, the new automated process improves the structural collection of comments and the organization of report documentation.

User friendly dashboard design

In addition, having key highlights from the report available in the dashboard allows for easier monthly comparisons and the ability to drill down into the numbers and find root causes. Contribute to more granular monitoring and alignment of KPIs with business initiatives and strategies.

Accessible and trustworthy data

The proposed solution includes the requirements of the YK management team and, equally important, their needs, which motivates greater acceptance and more efficient implementation of the proposed solution. This will improve the ability to review and compare past reports and decisions with current results and figures.

Paving the way for more user-friendly, automated financial reporting

This case demonstrates a practical approach for organizations facing challenges with establishing consistent financial reporting or managing financial data across multiple reporting platforms. By using Power Automate, we have provided an efficient solution for standardizing and automating financial reporting processes. This not only improves the user experience, but also ensures comparability and accuracy across the board. Contact us to learn how we can help you streamline your financial reporting setup with Power Automate and pave the way for a more efficient and effective financial management system.

Other projects

Case Study

Making faster and better strategic business decisions with data from user friendly dashboards

All sales data comes together in our clients current reporting system. The company makes strategic decisions based on the insights from these reports. However, the current reporting method is cumbersome, complex and there is no coherence in the way of reporting. Moreover, the data are hardly visualised, which makes it...
Case Study

Increasing customer value with a monitoring dashboard

Client: Sara Robotics Industry: Healthcare Process: Monitoring

Tell us your challenge.

We are here to help you.

Get in touch with our expert Joana to know more about this case!